In this blog, we will be looking at the crime data in the city of San Francisco. The data we will be using contains all crimes in San Francisco from the year 2018 to 2020. You can download the data here. Since this dataset is very large (more than 330,000 crimes), we will be considering only a small part of the data for this post.
# import libraries
import numpy as np
import pandas as pd
import folium
# read the data into a pandas dataframe
df = pd.read_csv('SF_Crime_data.csv')
df.head()
| Incident Datetime | Incident Date | Incident Time | Incident Year | Incident Day of Week | Report Datetime | Row ID | Incident ID | Incident Number | CAD Number | ... | Current Supervisor Districts | Analysis Neighborhoods | HSOC Zones as of 2018-06-05 | OWED Public Spaces | Central Market/Tenderloin Boundary Polygon - Updated | Parks Alliance CPSI (27+TL sites) | ESNCAG - Boundary File | Areas of Vulnerability, 2016 | Unnamed: 36 | Unnamed: 37 | |
|---|---|---|---|---|---|---|---|---|---|---|---|---|---|---|---|---|---|---|---|---|---|
| 0 | 2/3/2020 14:45 | 2/3/2020 | 14:45 | 2020 | Monday | 2/3/2020 17:50 | 89881675000 | 898816 | 200085557 | 200342870.0 | ... | 8.0 | 16.0 | NaN | NaN | NaN | NaN | NaN | 2.0 | NaN | NaN |
| 1 | 2/3/2020 3:45 | 2/3/2020 | 3:45 | 2020 | Monday | 2/3/2020 3:45 | 89860711012 | 898607 | 200083749 | 200340316.0 | ... | 2.0 | 20.0 | 3.0 | NaN | NaN | NaN | NaN | 2.0 | NaN | NaN |
| 2 | 2/3/2020 10:00 | 2/3/2020 | 10:00 | 2020 | Monday | 2/3/2020 10:06 | 89867264015 | 898672 | 200084060 | 200340808.0 | ... | 3.0 | 8.0 | NaN | 35.0 | NaN | NaN | NaN | 2.0 | NaN | NaN |
| 3 | 1/19/2020 17:12 | 1/19/2020 | 17:12 | 2020 | Sunday | 2/1/2020 13:01 | 89863571000 | 898635 | 206024187 | NaN | ... | NaN | NaN | NaN | NaN | NaN | NaN | NaN | NaN | NaN | NaN |
| 4 | 1/5/2020 0:00 | 1/5/2020 | 0:00 | 2020 | Sunday | 2/3/2020 16:09 | 89877368020 | 898773 | 200085193 | 200342341.0 | ... | 6.0 | 30.0 | NaN | NaN | NaN | NaN | NaN | 1.0 | NaN | NaN |
5 rows × 38 columns
# dimensions of the data
df.shape
(330054, 38)
There have been more than 330,000 crimes in San Francisco in the past two years.
df.columns
Index(['Incident Datetime', 'Incident Date', 'Incident Time', 'Incident Year',
       'Incident Day of Week', 'Report Datetime', 'Row ID', 'Incident ID',
       'Incident Number', 'CAD Number', 'Report Type Code',
       'Report Type Description', 'Filed Online', 'Incident Code',
       'Incident Category', 'Incident Subcategory', 'Incident Description',
       'Resolution', 'Intersection', 'CNN', 'Police District',
       'Analysis Neighborhood', 'Supervisor District', 'Latitude', 'Longitude',
       'point', 'SF Find Neighborhoods', 'Current Police Districts',
       'Current Supervisor Districts', 'Analysis Neighborhoods',
       'HSOC Zones as of 2018-06-05', 'OWED Public Spaces',
       'Central Market/Tenderloin Boundary Polygon - Updated',
       'Parks Alliance CPSI (27+TL sites)', 'ESNCAG - Boundary File',
       'Areas of Vulnerability, 2016', 'Unnamed: 36', 'Unnamed: 37'],
      dtype='object')
We do not need all these columns for our analysis. So we will consider only the necessary columns.
df = df[['Incident Datetime', 'Incident Day of Week', 'Incident Number', 'Incident Category', 'Incident Description',
         'Police District', 'Analysis Neighborhood', 'Resolution', 'Latitude', 'Longitude', 'point']]
df.head()
| Incident Datetime | Incident Day of Week | Incident Number | Incident Category | Incident Description | Police District | Analysis Neighborhood | Resolution | Latitude | Longitude | point | |
|---|---|---|---|---|---|---|---|---|---|---|---|
| 0 | 2/3/2020 14:45 | Monday | 200085557 | Missing Person | Found Person | Taraval | Lakeshore | Open or Active | 37.726950 | -122.476039 | (37.72694991292525, -122.47603947349434) |
| 1 | 2/3/2020 3:45 | Monday | 200083749 | Stolen Property | Stolen Property, Possession with Knowledge, Re... | Mission | Mission | Cite or Arrest Adult | 37.752440 | -122.415172 | (37.752439644389675, -122.41517229045435) |
| 2 | 2/3/2020 10:00 | Monday | 200084060 | Non-Criminal | Aided Case, Injured or Sick Person | Tenderloin | Financial District/South Beach | Open or Active | 37.784560 | -122.407337 | (37.784560141211806, -122.40733704162238) |
| 3 | 1/19/2020 17:12 | Sunday | 206024187 | Lost Property | Lost Property | Taraval | NaN | Open or Active | NaN | NaN | NaN |
| 4 | 1/5/2020 0:00 | Sunday | 200085193 | Miscellaneous Investigation | Miscellaneous Investigation | Richmond | Pacific Heights | Open or Active | 37.787112 | -122.440250 | (37.78711245591735, -122.44024995765258) |
Now, each row consists of the following 11 features:
- Incident Datetime: The date and time when the incident occurred
- Incident Day of Week: The day of week on which the incident occurred
- Incident Number: The incident or crime number
- Incident Category: The category of the incident or crime
- Incident Desccription: The description of the incident or crime
- Police: The police department district
- Resolution: The resolution of the crime in terms of whether the perpertrator was arrested or not
- Analysis Neighborhoods: The neighborhood where the incident took place
- Latitude: The latitude value of the crime location
- Longitude: The longitude value of the crime location
- point: A tuple of the latitude and logitude values
Let’s drop the missing values from the Latitude and Longitude columns as they will result in an error when creating a map.
df.dropna(subset=['Latitude', 'Longitude'], inplace=True)
Rename the Incident Category column for the sake of simplicity.
df.rename(columns={'Incident Category':'Category'}, inplace=True)
df.head()
| Incident Datetime | Incident Day of Week | Incident Number | Category | Incident Description | Police District | Analysis Neighborhood | Resolution | Latitude | Longitude | point | |
|---|---|---|---|---|---|---|---|---|---|---|---|
| 0 | 2/3/2020 14:45 | Monday | 200085557 | Missing Person | Found Person | Taraval | Lakeshore | Open or Active | 37.726950 | -122.476039 | (37.72694991292525, -122.47603947349434) |
| 1 | 2/3/2020 3:45 | Monday | 200083749 | Stolen Property | Stolen Property, Possession with Knowledge, Re... | Mission | Mission | Cite or Arrest Adult | 37.752440 | -122.415172 | (37.752439644389675, -122.41517229045435) |
| 2 | 2/3/2020 10:00 | Monday | 200084060 | Non-Criminal | Aided Case, Injured or Sick Person | Tenderloin | Financial District/South Beach | Open or Active | 37.784560 | -122.407337 | (37.784560141211806, -122.40733704162238) |
| 4 | 1/5/2020 0:00 | Sunday | 200085193 | Miscellaneous Investigation | Miscellaneous Investigation | Richmond | Pacific Heights | Open or Active | 37.787112 | -122.440250 | (37.78711245591735, -122.44024995765258) |
| 5 | 2/3/2020 8:36 | Monday | 200083909 | Miscellaneous Investigation | Miscellaneous Investigation | Central | Financial District/South Beach | Open or Active | 37.796926 | -122.399507 | (37.796926429317054, -122.39950750040278) |
limit = 100
df = df.iloc[0:limit, :]
# new dimensions of the data
df.shape
(100, 11)
Visualization
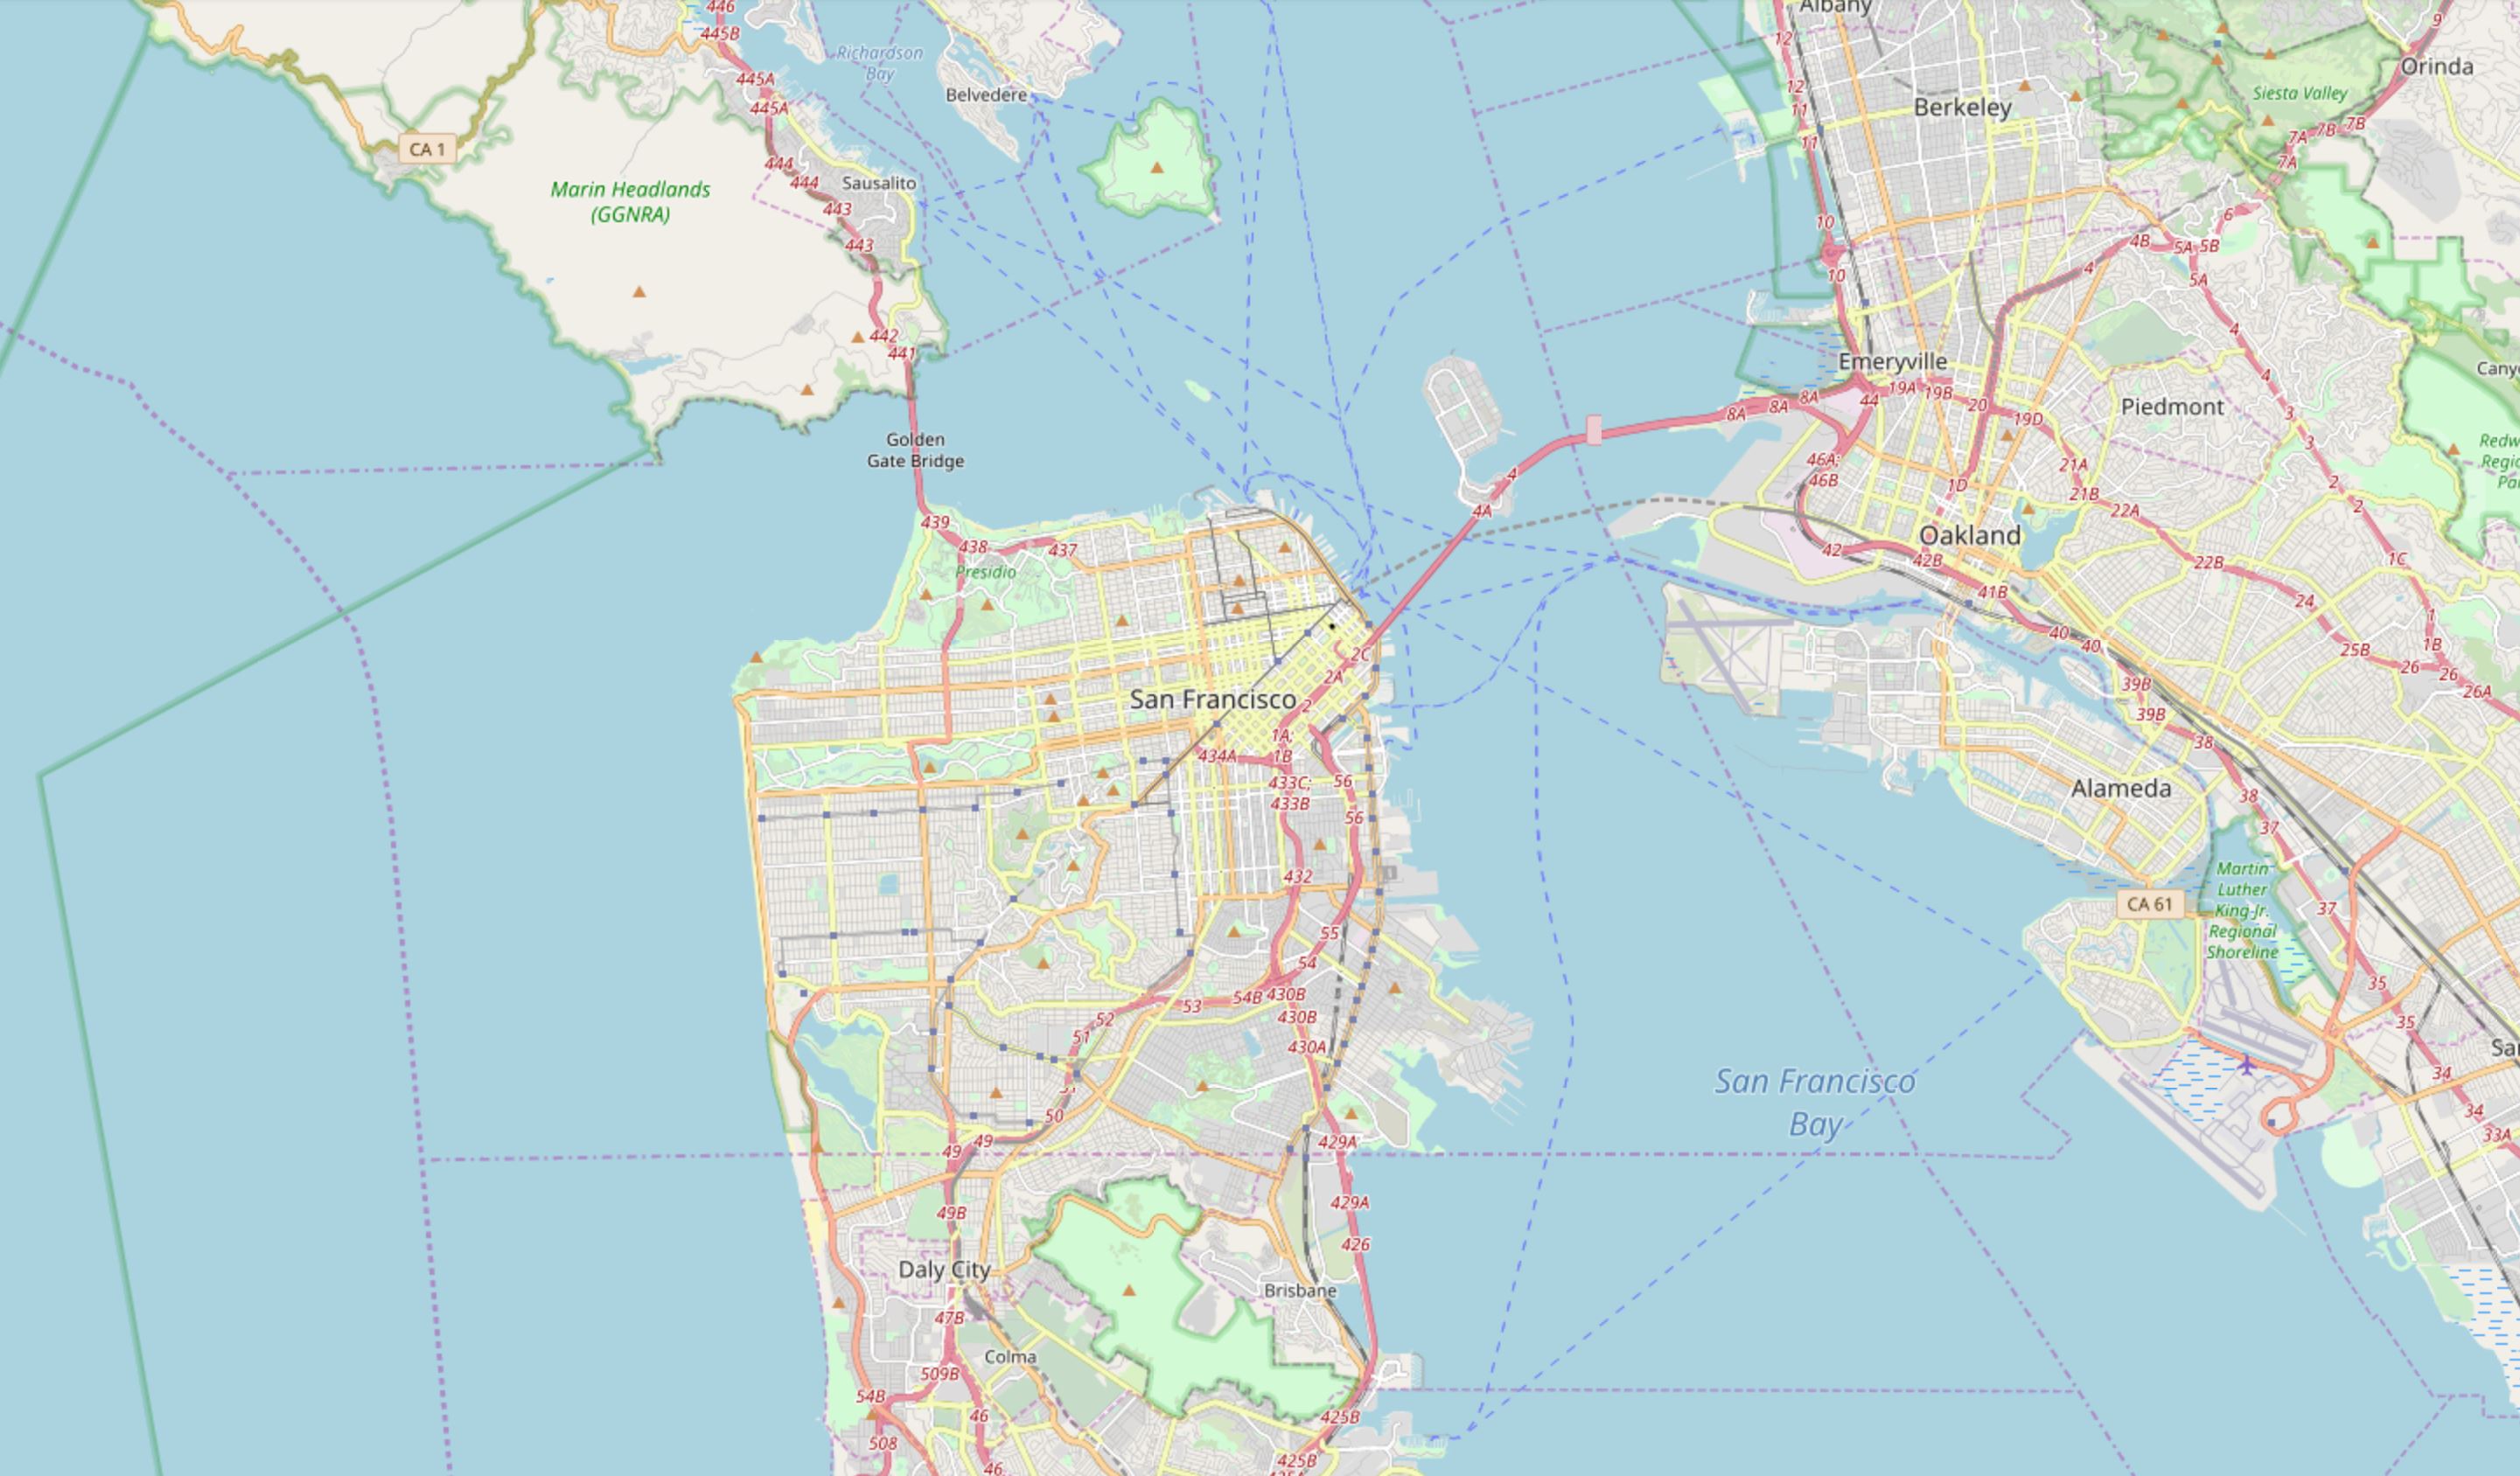
Let’s visualize where these crimes took place in the city of San Francisco.
# San Francisco latitude and longitude values
latitude = 37.7749
longitude = -122.4194
# create a map
sanfran_map = folium.Map(location=[latitude, longitude], zoom_start=12)
sanfran_map
Let’s group the markers into different clusters. Each cluster is then represented by the number of crimes in each neighborhood. These clusters can be thought of as pockets of San Francisco which you can then analyze separately.
We instantiate a MarkerCluster object and add all the data points in the dataframe to this object.
from folium import plugins

# let's start again with a clean copy of the map of San Francisco
sanfran_map = folium.Map(location = [latitude, longitude], zoom_start = 12)

# instantiate a mark cluster object for the incidents in the dataframe
incidents = plugins.MarkerCluster().add_to(sanfran_map)

# loop through the dataframe and add each data point to the mark cluster
for lat, lng, label, in zip(df.Latitude, df.Longitude, df.Category):
    folium.Marker(
        location=[lat, lng],
        icon=None,
        popup=label,
    ).add_to(incidents)

# display map
sanfran_map
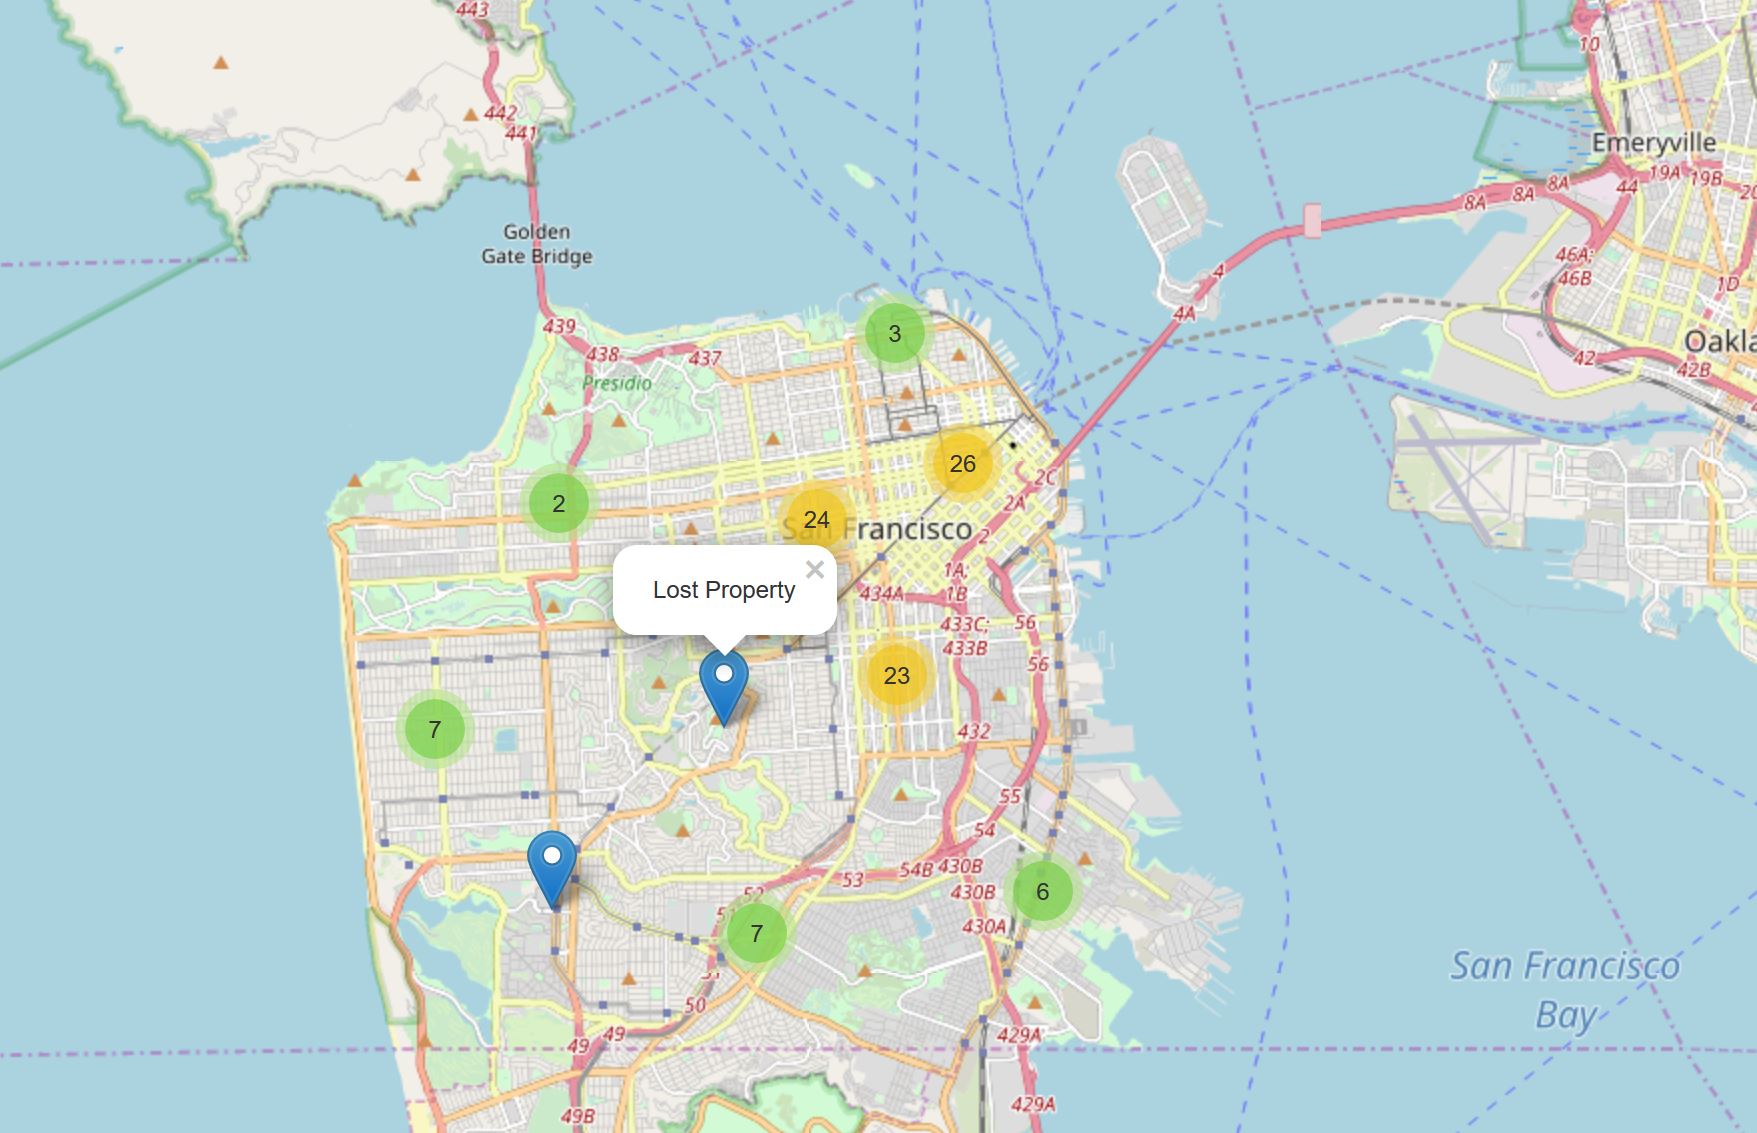
If run the above code in a Jupyter notebook, you can zoom out all the way, and you will see that all markers are grouped into one cluster - the global cluster of 100 crimes (which is the total number of crimes we have considered in our dataset). Once you start zooming in, the global cluster will start breaking up into smaller clusters. Zooming in all the way will result in individual markers.